Understanding Open Interest: A Comprehensive Guide to Gaining Directional Insight
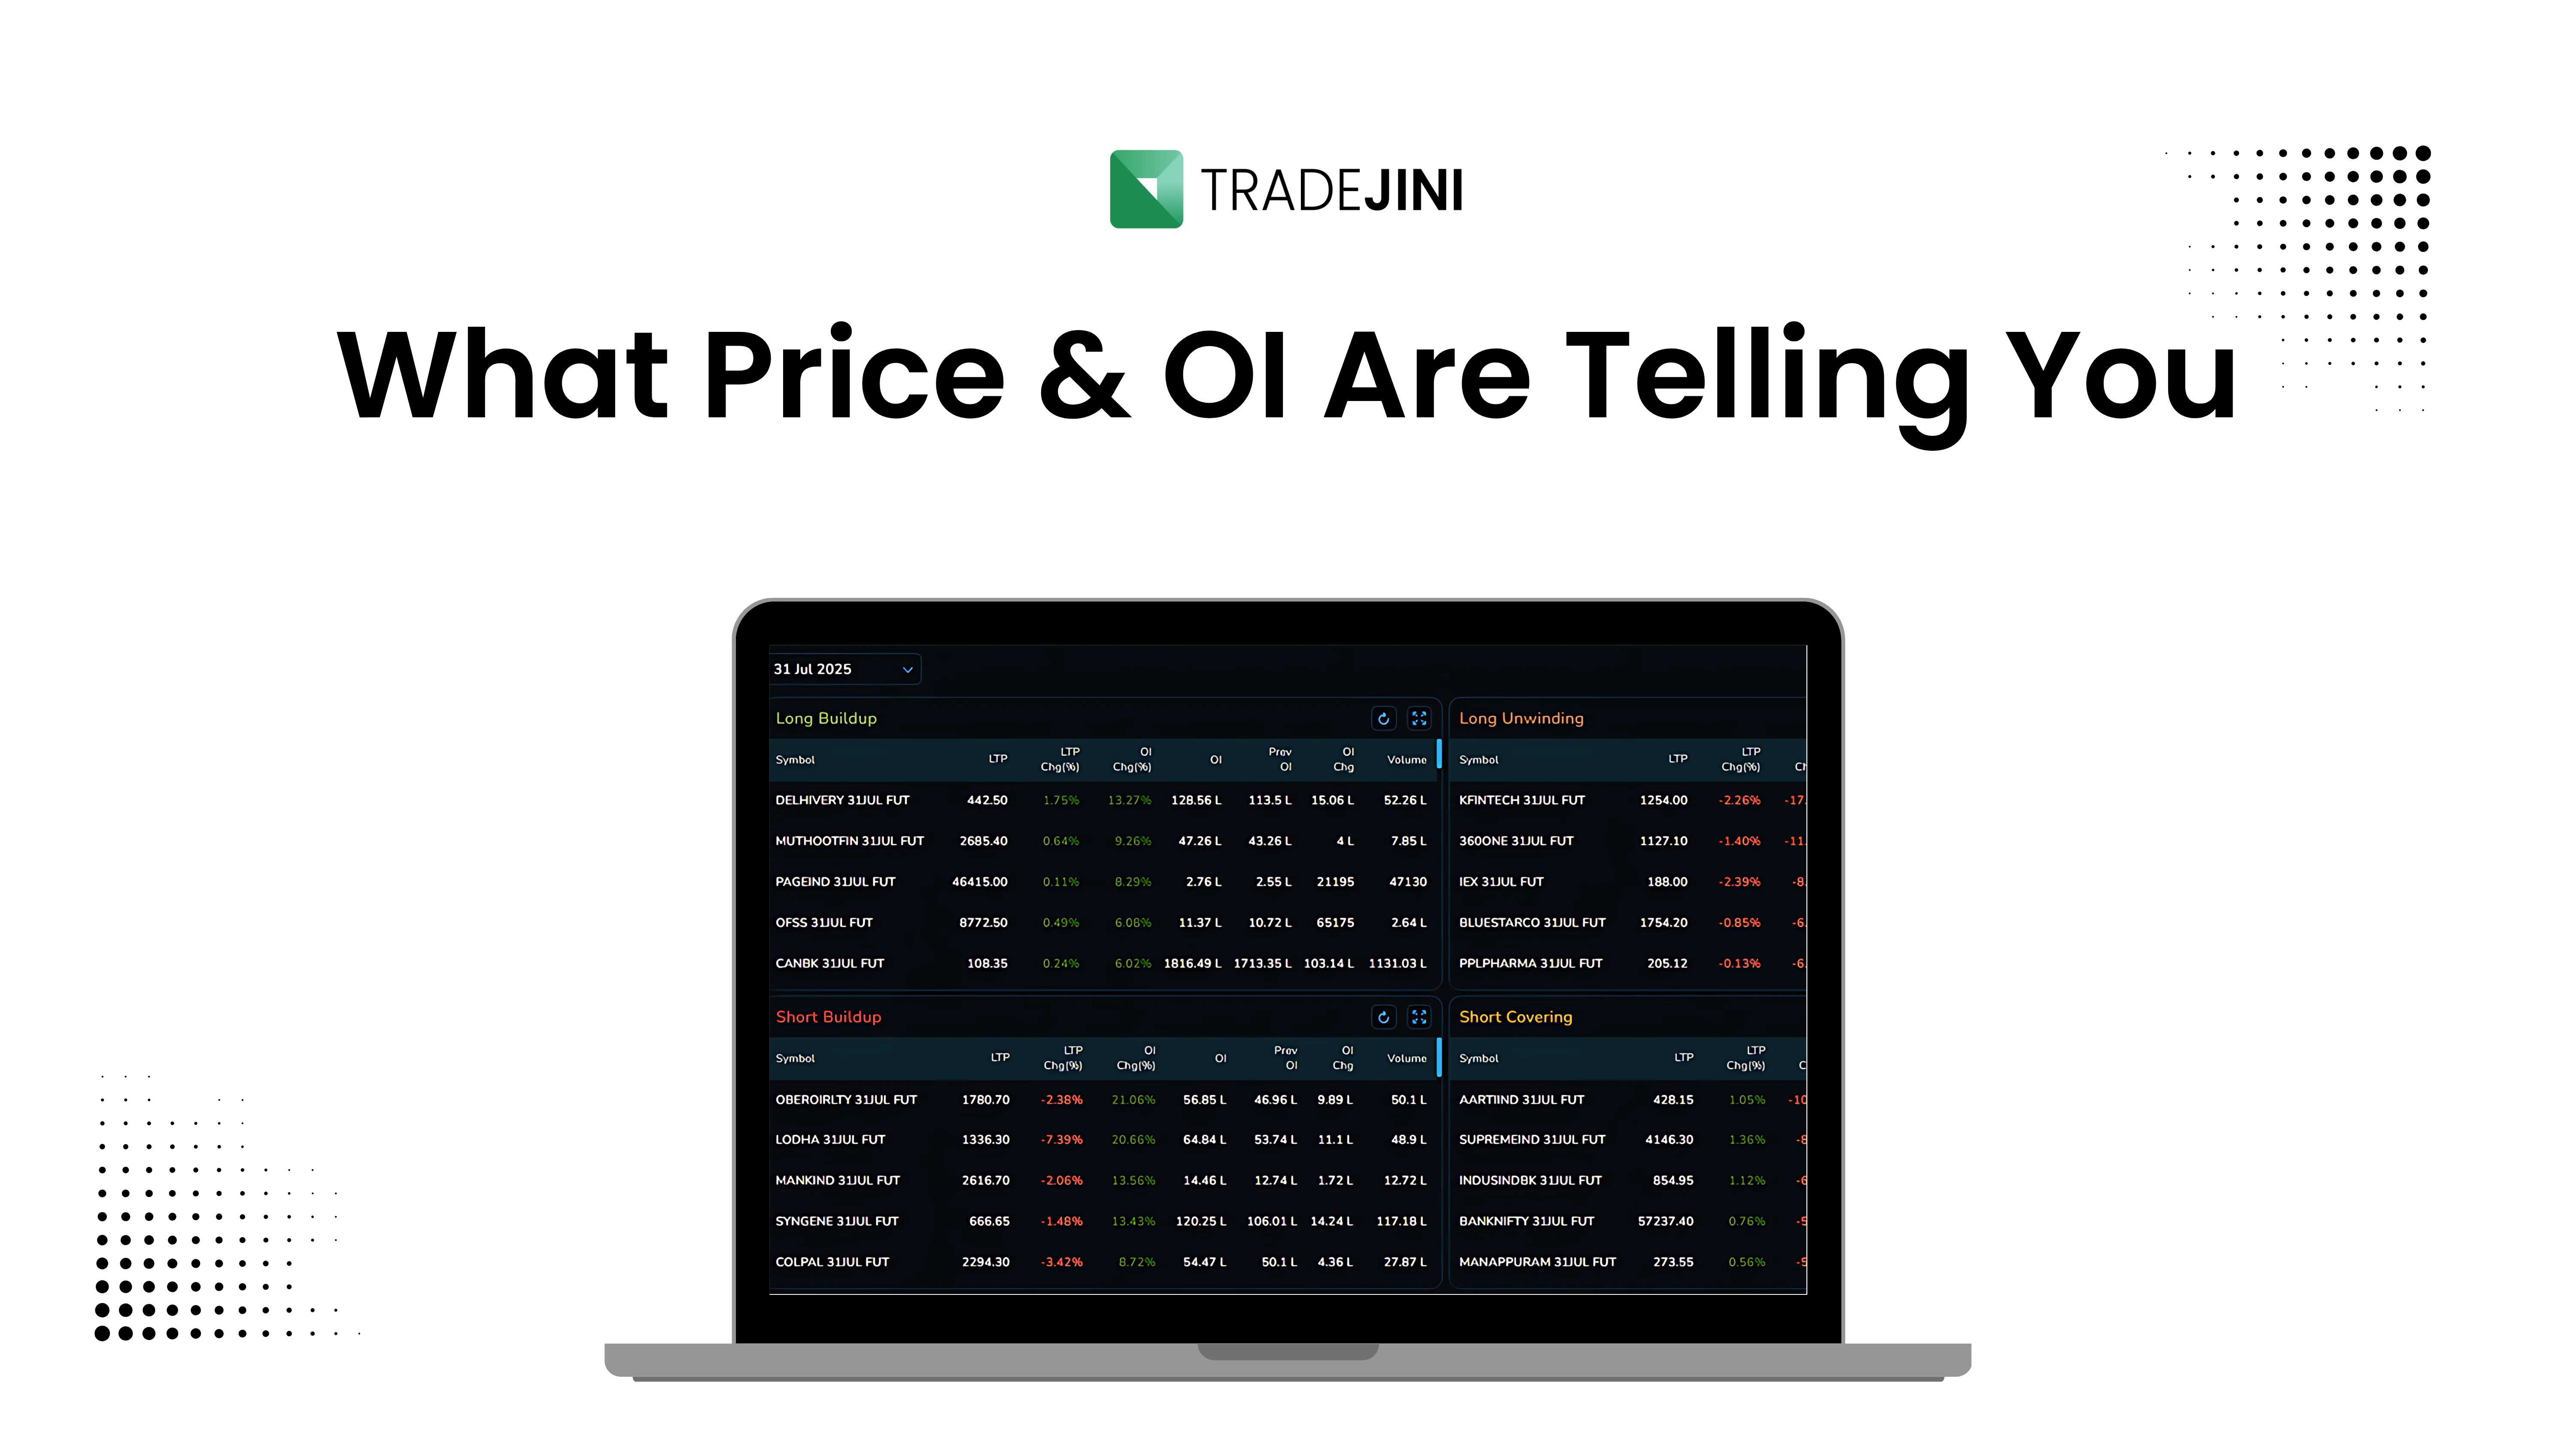
Image source: How to Interpret Open Interest and Price Data: A Trader’s Guide
Open interest is the number of outstanding, unsettled futures or options contracts, and traders read it by pairing it with price and volume rather than using it alone. For directional bias, the common rule of thumb is: price up + open interest up suggests bullish continuation, price down + open interest up suggests bearish continuation, price up + open interest down suggests short covering, and price down + open interest down suggests long unwinding or a weakening downtrend. 1, 2
What open interest means
Open interest is a stock of live contracts, not a count of trades in a session. It increases when new positions are created and decreases when existing positions are closed. That is why it behaves differently from volume, which resets each day and counts executed trades over a period. 2, 1
How to read bias
A useful way to read directional bias is to ask two questions: is fresh money entering, and is price confirming it. If both price and open interest rise, the move has participation behind it, so trend-following traders usually treat that as bullish or bearish continuation depending on direction. If price rises while open interest falls, the rally may be driven by shorts buying back, so the move is often weaker than it first looks. If price falls while open interest falls, the market may be exhausting selling pressure rather than building a stronger downtrend. 1, 2
Practical reading table
| Price | Open Interest | Typical read |
|---|---|---|
| Up | Up | Bullish buildup / trend confirmation 1 |
| Down | Up | Bearish buildup / trend confirmation 1 |
| Up | Down | Short covering, possible weak rally 1, 2 |
| Down | Down | Long unwinding, possible weakening downside 1, 2 |
Common mistake
High open interest does not automatically mean bullishness. It only means there are many outstanding contracts, and those contracts can be long or short on either side. Direction comes from the combination of price, open interest, and often volume or broader context such as expiry, rollover, or hedging flows. 3, 1
Simple example
If a futures market rises from 100 to 104 while open interest climbs from 1,000 to 1,300 contracts, the move is usually read as new buyers supporting the uptrend. If the same rise happens while open interest drops from 1,300 to 1,000, the move is more likely short covering than fresh conviction. 2, 1

How to use it
Use open interest as a confirmation tool, not a standalone signal. The best read usually comes from combining it with trend, volume, and key levels so you can tell whether the market is building positions or merely closing them out. 1, 2
References
-
Interpreting Open Interest in Futures Markets for Better Trades
-
What is Open Interest (OI)? OI vs Volume in Futures Trading - Zerodha
-
How to Interpret Open Interest and Price Data: A Trader’s Guide
-
Directional Bias - SOLVED with DRT | A Simple Method … - YouTube
-
Decoding the Options Market: Volume & Open Interest Analysis
-
How to identify directional bias using ICT concepts - YouTube
-
ICT Daily Bias Explained — How to Set Bullish or Bearish Bias (Free …
-
Decoding Market Maker Positioning: How to Read Open Interest …
-
Learn Open Interest: How To Identify Market Trends and Reversals using OI?
-
Open Interest Data Analysis || OI Data || OI Change || Explained | Angel One